
Running Docker on a shared-vCPU VPS: what actually degrades, and what to measure

The symptom is always the same and it is always confusing. Average CPU on the box sits at 30 or 40 percent. Grafana is calm. But p99 latency jumps to five or ten times the median for a few seconds at a time, your health check occasionally times out and the orchestrator pulls the container out of rotation, and the same Dockerfile that built in 90 seconds this morning takes four minutes now. Nothing in your code changed.
On a shared-vCPU VPS there are two mechanisms that produce almost identical symptoms, and they demand opposite responses. One is hypervisor steal — the host is genuinely busy running someone else and your vCPU is waiting for a physical core. The other is CFS bandwidth throttling — the Linux scheduler is putting your own container to sleep because you set a CPU limit, and possibly because of a kernel bug that has nothing to do with your neighbours. Set a CPU limit, watch p99 spike, and blame the host, and you will buy a bigger plan that fixes nothing. This is how to tell them apart from a terminal, with the exact files and the exact output.
Mechanism 1: steal time, the one the host owns
Steal (%st in top, mpstat, vmstat) is the fraction of time your vCPU was runnable — it had work — but the hypervisor was servicing another guest instead of scheduling you onto a physical core. You cannot fix it from inside the guest. It is the honest cost of sharing a socket.
The clearest demonstration I know of is in the Opensource.com walkthrough on detecting steal time (January 2020). They loaded all of a guest's vCPUs with stress, then loaded the hypervisor's physical CPUs at the same time. top reported a steal figure of 9.0, and the four guest vCPUs that should each have hit 100 percent could only reach 99.3, 99.3, 86.4 and 74.4 percent respectively — the article works this out to roughly 40 percent of a vCPU's worth of compute simply gone. That is what real contention looks like from inside: cores that will not fill up, and the missing slice showing up as steal.
Note what the numbers were not: they were not a neat 91 or 95 percent cap. Do not memorise a magic capped-percentage. Measure your own.
Mechanism 2: CFS throttling, the one you usually own
If you run docker run --cpus=1.5, or set cpus: "1.5" in Compose, or a Kubernetes limits.cpu, Docker translates that into a CFS bandwidth quota: a cpu.cfs_quota_us over a cpu.cfs_period_us (default period 100 ms). Your container may use up to that quota within each 100 ms window. Spend it early and the scheduler throttles you — the container is put to sleep until the next period begins. A request that arrives during that sleep waits out the remainder of the window before a thread can run again.
This is not the host stealing from you. It is the kernel enforcing a limit you set, and it is completely invisible to %st. Steal will read zero while your tail latency is being shredded. That is exactly why people misdiagnose it.
The mechanism bites hardest on multithreaded runtimes. A service with, say, eight worker threads on a 1-CPU limit can burn its entire 100 ms quota in the first ~12 ms of the period by running eight threads in parallel, then sit throttled for the remaining ~88 ms. Average CPU over the second looks modest. The p99 request that landed at millisecond 15 ate the stall.
The reading that settles it: cpu.stat
Throttling is counted, precisely, per container. On a cgroup v2 host, from inside the container:
The number that matters is the ratio Indeed's engineers used in their write-up: throttled percentage = nr_throttled ÷ nr_periods. Here that is 9821/18344, about 54 percent — more than half of all scheduling periods ended with the container throttled. When that ratio is high and %st is low, the cause is your CPU limit, not your neighbour. When nr_throttled barely moves and %st is high, it is the host. That single comparison is the whole diagnostic.
(On older cgroup v1 hosts the same fields live under /sys/fs/cgroup/cpu,cpuacct/…/cpu.stat. Watch nr_throttled increment with watch -n1 rather than reading it once.)
The comparison table
| SignalHypervisor stealCFS throttling (self-inflicted or kernel bug) | ||
mpstat -P ALL 1 %st | Elevated, sustained | ~0 |
cpu.stat nr_throttled | Flat | Climbing every second |
| Fix location | The host (migrate, or a plan with pinned cores) | Your CPU limit — or the kernel version |
| vCPUs hit 100%? | No, they cap short | Yes, briefly, then sleep |
| Visible to your provider? | Yes, on their side | No — only you can see it |
The commands, in order
Install sysstat and run these on the VPS while the symptom is live:
mpstat -P ALL 1 30— per-core view. Look at the%stealcolumn on every logical CPU. Steal on all cores points at the host; steal on one core points at pinning or a single-threaded neighbour.vmstat 1— thestcolumn, quick confirmation.cat /sys/fs/cgroup/cpu.statinside the container, twice, a few seconds apart — watch whethernr_throttledandthrottled_usecmove.
If nr_throttled is climbing, temporarily remove the CPU limit (--cpus / the Compose cpus: / the k8s limits.cpu) and re-measure p99. If the spikes vanish, the limit was the cause and no host change would have helped.
The kernel bug you must rule out before blaming anyone
Here is the part that upgrades a lot of servers for the wrong reason. For years there was a bug in the Linux CFS bandwidth controller itself: containers were throttled long before they had actually spent their quota, because a scheduler commit expired unused cpu-local time slices too aggressively. Indeed's engineering team documented it in their “Unthrottled” series. They traced it to commit 512ac999d275 (“sched/fair: Fix bandwidth timer clock drift condition”), which landed in the 4.18 kernel and was backported into RHEL, CentOS and Ubuntu stable trees. One of their applications was seeing an idle service with a 4.1-CPU allocation throttled while using under 0.5 CPU. Removing the regression cut that application's worst-case response latency from over two seconds to 30 milliseconds — with no change to the CPU limit.
The real fix, Dave Chiluk's commit de53fd7aedb1 (“sched/fair: Fix low cpu usage with high throttling by removing expiration of cpu-local slices”), merged into mainline for the 5.4 kernel. On their artificial test — 10 ms of quota per 100 ms period on an 80-CPU machine — the patch delivered close to a 30x improvement while still honouring the quota. A substantial share of the throttling people were seeing came from the kernel, and the kernel fix alone recovered it without anyone touching a limit.
So before you conclude your CPU limit is wrong or your host is noisy: uname -r. If you are below 5.4 — and plenty of long-lived LTS boxes still are — a share of your nr_throttled is the kernel, and upgrading it is the cheapest fix on this list. This is the remedy an older-kernel reader most often misses, and it costs nothing.
Why 50 percent is your real ceiling, not 100
Even with a correct kernel and a sane limit, container CPU limits change the capacity maths. Dan Luu, writing from measurements at Twitter, found that “most CPU bound services start falling over at around 50% reserved container CPU utilization, and almost all services start falling over at not much more.” The reason is the same throttling mechanism: bursty, multithreaded services exhaust their per-period quota during traffic peaks well before their average utilisation looks high, so the average badly understates how close to the wall they run. In his write-up, tuning thread-pool sizes to stop over-parallelising within a period bought roughly 2x the capacity for one service, and an internal kernel patch that stopped containers overrunning quota produced about a 50 percent cost reduction for a typical service with untuned pools.
The practical takeaway: on a shared-vCPU box, plan around a CPU-bound container tipping over near 50 percent of its reserved CPU, not 90. If you size to average utilisation you will be surprised at every traffic peak.
When is steal actually “too much”?
Be careful here, because this is exactly where a hosting article will quietly invent a low threshold to sell you an upgrade. I will not. Independent sysadmin guidance from Danila Vershinin's GetPageSpeed write-up gives a working rule: if %st sits above 10 percent for around 20 minutes, you are degraded by contention and it is worth changing plan or host. The Opensource.com demonstration above produced a steal figure of about 9 only when the physical CPUs were deliberately saturated. Brief steal spikes are normal on any shared platform and are not a reason to do anything. Do not act on a single 4-percent reading, and be suspicious of any source — us included — that sets the alarm lower than roughly 10 percent sustained.
Workloads that genuinely do not care
Steal only hurts when you have work waiting on CPU. Plenty of containers do not, and moving them to dedicated cores is money wasted:
- I/O-bound services — a reverse proxy, a static file server, most CRUD APIs whose time goes to the database and the network. If a request spends 5 ms on CPU and 80 ms waiting on Postgres, 8 percent steal is noise.
- Idle-most-of-the-time sidecars — log shippers, metrics agents, cron-driven jobs with slack in their schedule.
- Latency-insensitive batch — nightly ETL, backups, image processing queues. They care about throughput over hours; a few percent steal just makes the batch marginally longer, and nobody is watching p99.
The workloads that do care are CPU-bound, latency-sensitive, and multithreaded: game servers, real-time bidding, low-latency APIs, CI runners where a 3x build-time swing actually costs you. Those are the ones worth pinned or dedicated cores — and worth the diagnosis above before you buy them.
The decision rule
When p99 spikes on a flat average: run mpstat -P ALL 1 and read cpu.stat at the same time. High %st, flat nr_throttled → it is the host; check your kernel is 5.4+, then talk to your provider about steal or move to a plan with allocated cores. Low %st, climbing nr_throttled → it is you; upgrade past kernel 5.4 if you are behind, then raise or remove the CPU limit and re-measure. Do not buy hardware to fix a number you have not yet looked at.
If you are weighing whether shared vCPU is the right tier for a given workload at all, our breakdown of VPS vs dedicated vs shared hosting and the notes in how to choose the right VPS plan cover the tier trade-offs; the point of this page is that you diagnose first and choose second.
Choosing the plan type
If the checks above show real steal time rather than self-inflicted cgroup throttling, the fix is reserved cores. Karizanta labels every VPS plan as shared vCPU or dedicated CPU, and the dedicated-CPU tier reserves physical cores for your instance alone: compare them on the UK VPS, Sweden VPS and Netherlands VPS pages, or move to a UK dedicated server when a single machine is the better answer.
Sources
- The container throttling problem (Dan Luu) (unknown)
- Unthrottled: Fixing CPU Limits in the Cloud (Indeed Engineering) (2019-12)
- sched/fair: Fix low cpu usage with high throttling by removing expiration of cpu-local slices (Linux commit de53fd7aedb1) (2019-09)
- Detecting CPU steal time in guest virtual machines (Opensource.com) (2020-01)
- VPS Is Still Shared Hosting: Diagnose Noisy Neighbors the Right Way (GetPageSpeed / Danila Vershinin) (unknown)
Frequently asked questions
My CPU steal is near zero but p99 latency still spikes. What is happening?
Almost certainly CFS throttling, not the host. Read /sys/fs/cgroup/cpu.stat inside the container and watch nr_throttled: if it climbs while %st stays flat, your own CPU limit (--cpus, Compose cpus:, or k8s limits.cpu) is putting the container to sleep at the end of each 100ms scheduling period. Raise or remove the limit and re-measure before touching the host.
How do I tell hypervisor steal apart from cgroup throttling?
Run mpstat -P ALL 1 and cat /sys/fs/cgroup/cpu.stat at the same time. High %steal with flat nr_throttled means the host is contended and you fix it on the provider side. Low %steal with rising nr_throttled means your CPU limit (or an old kernel) is throttling you, which you fix yourself. They produce identical symptoms, so measure both.
Could a Linux kernel bug be causing my container throttling?
Yes, if you run a kernel below 5.4. A CFS bandwidth regression from commit 512ac999d275 (in 4.18, backported to RHEL, CentOS and Ubuntu) throttled containers before they had spent their quota. Indeed traced it and Dave Chiluk's fix, commit de53fd7aedb1, merged for kernel 5.4. Check uname -r; upgrading past 5.4 can remove throttling with no change to your CPU limits.
At what steal percentage should I move off a shared-vCPU VPS?
Independent guidance from GetPageSpeed suggests that %steal sustained above 10% for around 20 minutes indicates real contention worth acting on. Brief spikes are normal on any shared platform. Be wary of any threshold set noticeably lower than that, especially from a host that sells the upgrade.
Which Docker workloads do not care about CPU steal?
Anything that is not waiting on CPU: I/O-bound services (reverse proxies, most CRUD APIs bound by the database), idle-most-of-the-time sidecars like log shippers and metrics agents, and latency-insensitive batch jobs such as nightly ETL and backups. For these, a few percent steal is noise and dedicated cores are wasted money. CPU-bound, latency-sensitive, multithreaded services are the ones that need pinned cores.
Related reading
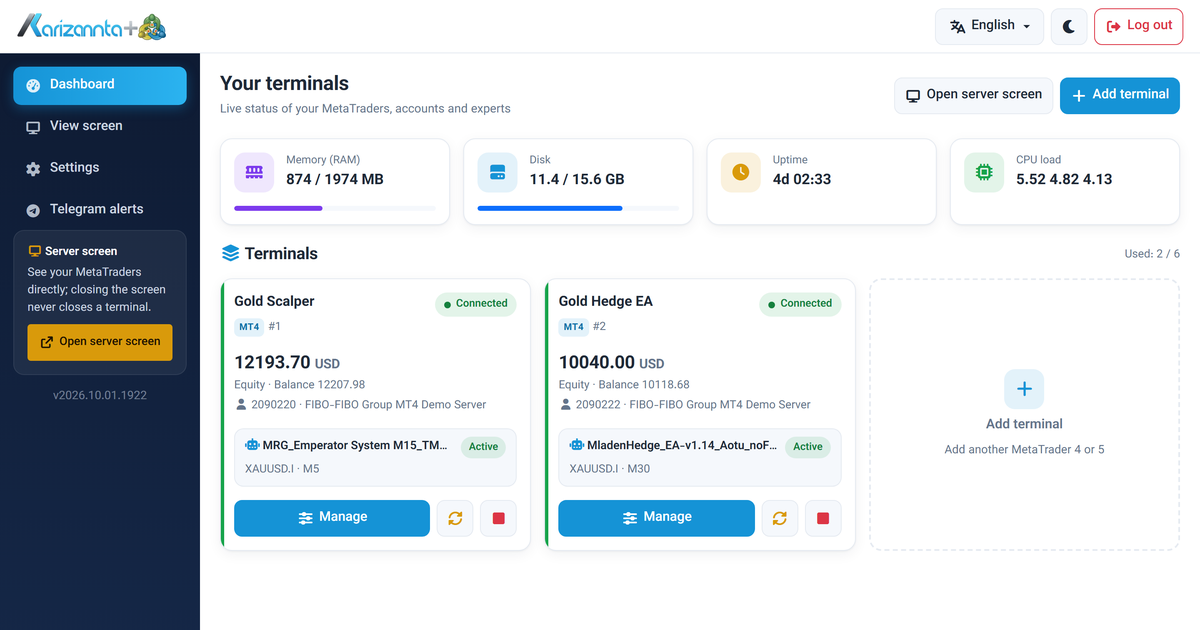
MetaTrader VPS on Linux: Run MT4 and MT5 Expert Advisors 24/7
A MetaTrader VPS that keeps MT4 and MT5 running on its own: automatic re-login after every restart, a web panel for accounts and expert advisors, and Telegram alerts. A tour with screenshots.
Read more →
Self-host n8n on a VPS with Docker and Postgres
A complete, copy-pasteable path to run n8n on your own Ubuntu VPS with Docker Compose and Postgres: the environment variables that matter, nginx and TLS, and the webhook, timezone and queue-mode traps that catch everyone.
Read more →
Self-host Vaultwarden on a VPS: the secure setup
A copy-pasteable path to run Vaultwarden 1.37.3 behind nginx and TLS on a small VPS, with the security steps that matter: admin token hashing, closed signups, a WebSocket-aware proxy, fail2ban on the login endpoint, and a backup you have actually restored.
Read more →